Ian Saunders
Maps represent one of the most important tools that geographers use to communicate information about the spatial associations of the phenomena which they study. We can think of maps as being models, in the sense that they typically aim to reduce the complexity of the real world into something that can be studied more easily. There is a bewildering array of map types; common map types are base maps, which show the essential features of the landscape, and thematic maps, which show the spatial distributions of probably any geographic variable you care to think of. In Canada, base mapping at the federal government level is referred to as the National Topographic System (NTS).
This lab is largely about how to use NTS maps, plus some Google Earth (Web) practice, to address fundamental questions that geographers ask: How can we specify where a place is? (Geographers know where it’s at!) How far is it between two places?
Learning Objectives
After completion of this lab, you will be able to
- Use geographical coordinates to specify locations.
- Understand the applications of map scales.
- Derive distances from a map.
- Use Google Earth (Web) to derive coordinates and distances.
Pre-readings
Geographical Coordinates
The term geographical coordinate refers to the latitude-longitude system, which defines a location using angles measured from some prescribed baseline. Latitude is the angle measured north or south from the equatorial plane to your position. Lines of equal latitude form parallels that run west-east. The Equator is at latitude 0°. Latitude ranges from 90°S (South Pole) to 90°N (North Pole). When using latitude data in purely numerical form (i.e. the N or S isn’t specified), northern hemisphere data are considered as positive and southern hemisphere data negative. Unless you’re using purely numerical data, you must specify N or S to avoid ambiguity.
Longitude is the angle measured west or east from the Prime Meridian (or Greenwich Meridian, since it runs through the observatory at Greenwich, England) to your position. Lines of equal longitude form meridians that run north-south from the North Pole to the South Pole. This means they are not parallel: they are farthest apart at the Equator and converge towards the poles. The Prime Meridian is at longitude 0°. Longitude ranges from 180°W to 180°E. When using longitude data in purely numerical form (i.e. the W or E isn’t specified), eastern hemisphere data are usually considered as positive and western hemisphere data negative (but beware – occasionally you may come across the reverse of this convention, for example when using online distance calculators; you need to stay sharp!). Unless you’re using purely numerical data, you must specify W or E to avoid ambiguity. Note that the 180°W meridian is also exactly the same as the 180°E meridian, and is also the general location of the International Date Line.
Geographical coordinates are based on angles, and there are two common ways to express these:
- In decimal degrees (DD). Here are three examples: (i) 50.6°N; (ii) 50.57°N; (iii) 50.56789°N. Obviously, the more decimal places we use, the greater the implied accuracy of the coordinate. Using coordinate (i) would be appropriate when defining the location of a town, for example, because this only requires an approximate value. But if we wanted to define the location of a particular building in that town, then greater precision is required, and the extra decimal places in coordinate (iii) would be needed.
- Using a sexagesimal system, which divides one degree into sixty minutes and one minute into sixty seconds. Here are three examples, exactly the same as those in (a), above: (i) 50° 36′ N; (ii) 50 34′ 12″ °N; (iii) 50 34′ 04.404″ °N. Notice here that if we want to specify very precise locations using the sexagesimal system, we have to add decimal places to the seconds. The units of this system are degrees, minutes and seconds, and hence the units of this system are commonly abbreviated to DMS.
Geographical Coordinates on Maps
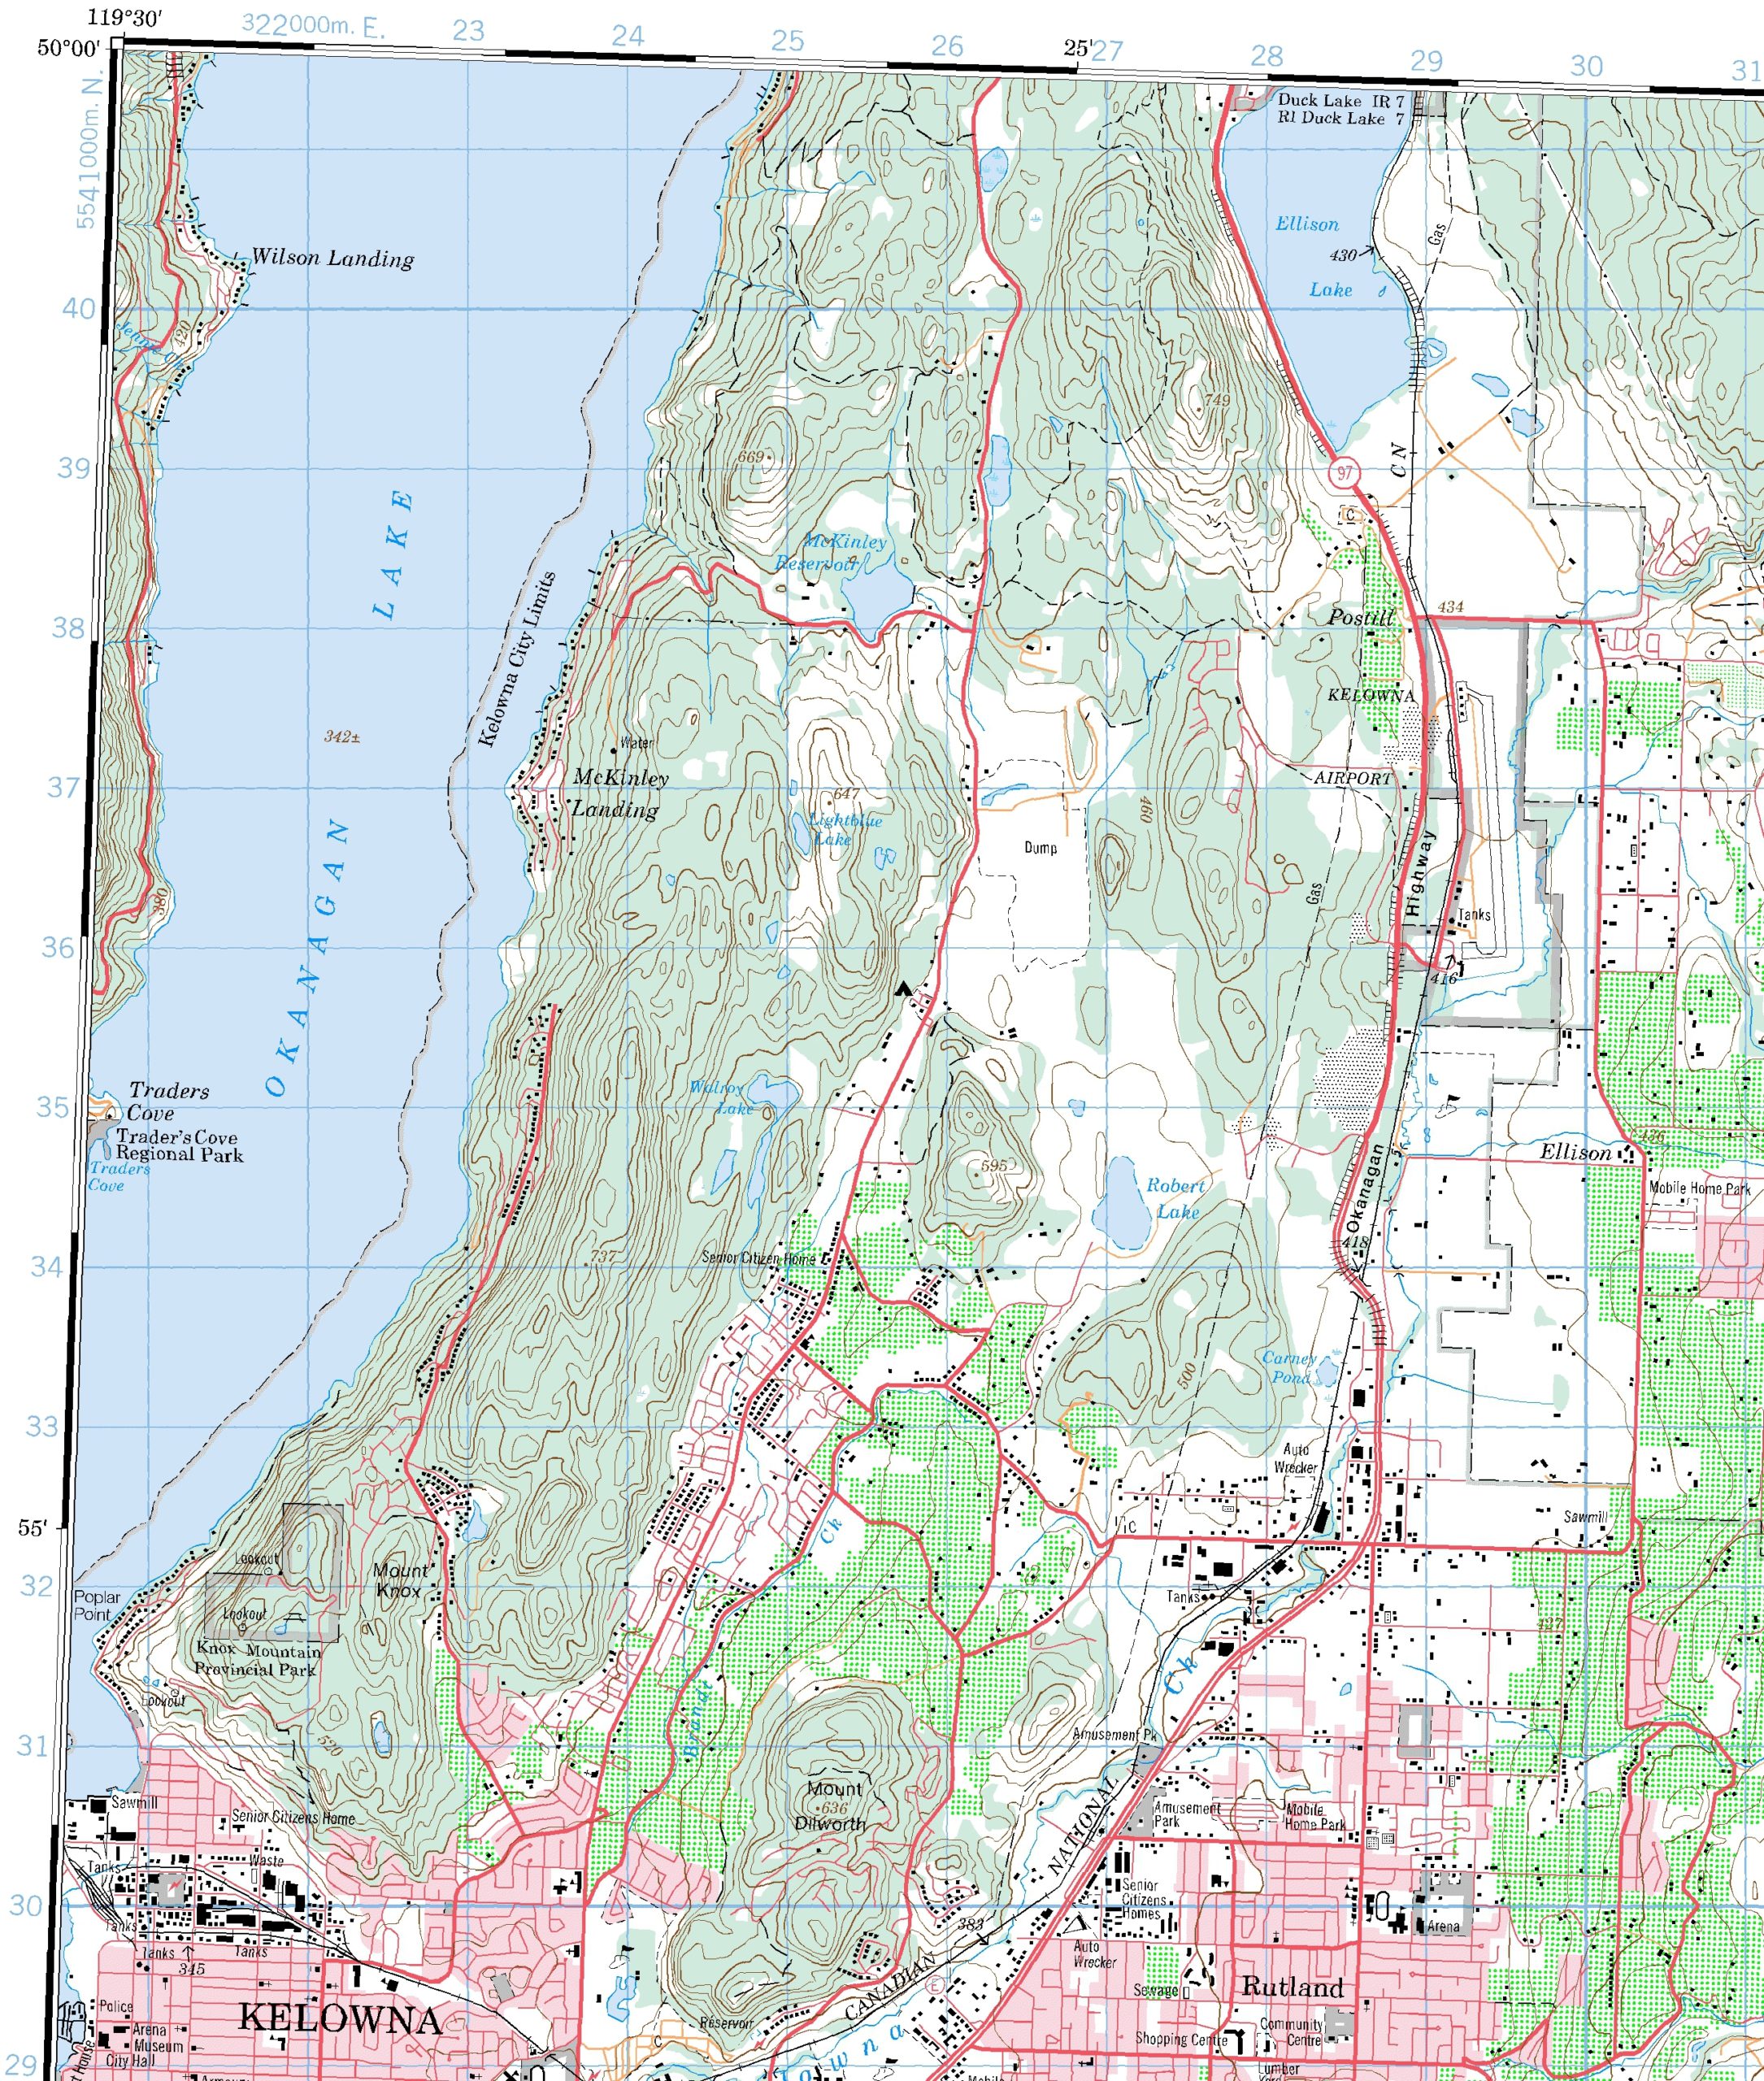
Different mapping agencies use different ways to denote geographical coordinates on maps, but a common method is to show latitude and longitude markers around the margins. On Canadian 1:50,000 NTS maps (e.g., Figure 3.1), the alternating black and white bar lines along the margins represent minutes of latitude (vertical lines) and longitude (horizontal lines). The latitude increases as one moves northwards (up) away from the Equator and longitude increases as one moves westwards (left) away from the prime meridian. It might also be useful to note that the neatlines (i.e. the actual edge of the map) of NTS maps are defined by parallels and meridians (i.e. the top and bottom edges run exactly west-to-east, and the sides run exactly north-to-south).

There are several items to note in Figure 3.1:
- The marginal information related to geographical coordinates is in black and white:
- black and white bars up the side: there are seven of them, each representing one minute of latitude, and therefore the north-south extent of the map shown here is nearly 7 minutes of latitude. Every fifth minute has a label: notice the 55′ marker in the lower-left edge of the map.
- black and white bars along the top margin each represent one minute of longitude, and therefore the west-east extent of the map shown here is about 8½ minutes of longitude.
- The northwest corner of the map has coordinates of 50°00′ and 119°30′, but we are not told which hemispheres. The map-makers assume that we know that Canada is in the northern and western hemispheres.
- Values of latitude increase bottom-to-top, because we are moving farther away from the Equatorial plane. Values of longitude increase right-to-left, because we are moving farther away from the Prime Meridian.
For instructions on how to determine the geographical coordinates of a location when using a NTS map, refer to the Supporting Material.
Map Scales
The world is big. Maps are small. So, real-world sizes have to be reduced in order to fit the landscape onto a map, and the map scale tells us how much size reduction has taken place.
Map scale can be expressed in several different ways:
- Graphic scale: a simple line or bar on the map that states the real-world distance (Figure 3.5). It is simple and intuitive to use.
- Ratio scale: one unit of linear distance (e.g. millimetre, inch, etc.) on the map represents some number of the same units in the real-world. In the previous section, reference was made to 1:50,000 maps – this simply means that 1 mm on the map represents 50,000 mm in the real-world, or 1 inch represents 50,000 inches, and so on. The standard convention is to use the form 1:n, where n can be any number.

- Verbal scale: typically, a statement that relays the same information as a ratio-type scale. For example: 1 cm represents 1 km is self-explanatory – it means that a distance of 1 cm on the map is equivalent to one kilometre in the real-world (so the ratio scale would be 1:100,000). Slightly more esoteric examples are: 5 cm to 1 km, or 1 cm equals 20 km, neither of which makes complete grammatical or logical sense, but the meaning should be fathomable for any geographer (the ratio scales are 1:20,000 and 1:2,000,000, respectively).
Being able to convert between different types of scale is a useful skill.
We sometimes hear the terms small-scale map, medium-scale map or large-scale map, and it can be confusing. Perhaps the simplest way to think about this is to realize that a large-scale map will show a given feature larger on the map than a small-scale map would. Think about fitting a map of Canada on this page – you have to shrink the country very small in order to do so, and British Columbia would occupy only a small part of the page. This is a small-scale map. Now envisage a map only of British Columbia on this page – obviously, we can make it larger, and so the scale has become larger, although it would still not be considered a large-scale map. An example of a large-scale map is a 1:50,000 map sheet, where the map shows the landscape in fine detail. You may also think of this mathematically: convert the ratio to a fraction, and the smaller the fraction, the smaller the map-scale.
Again (because it’s important!), map scale always boils down to this basic ratio:
(the length of a feature on the map) : (the real-world length of the same feature)
…and the units must be identical either side.
As an example, on your map the straight-line distance between your house and the shopping mall is 120 mm. In the real-world, this distance is 2.4 km. So, your map’s scale is 120 mm : 2.4 km = 120 mm : 2,400,000 mm = 1:20,000.
Conceptually, we can think of map scale as the ratio between the distance between any two points on the map (map distance) compared to the actual distance out in the field (ground distance) represented. This concept can also be expressed mathematically as:

Working scale requires converting between many units because distances on the map are measured with rulers (typically in centimetres and millimeters) and distances in the field are much longer (typically distances of many metres or kilometres). Therefore, the following conversions are important.
1 m = 100 cm
1 km = 1,000 m
1 km = 100,000 cm
Deriving Distances from a Map
Conceptually, this is simple: measure the distance on the map and multiply it by the scale. For example, 45 mm on a 1:50,000 map represents:
![]()
in the real-world. Knowing that 1 m = 1000 m, we can convert this distance to 2250 m.
Measuring straight-line distances is easily achieved with a ruler, of course. Alternatively, you could use the edge of a piece of paper and find the map distance and then compare it to the graphic scale bar.
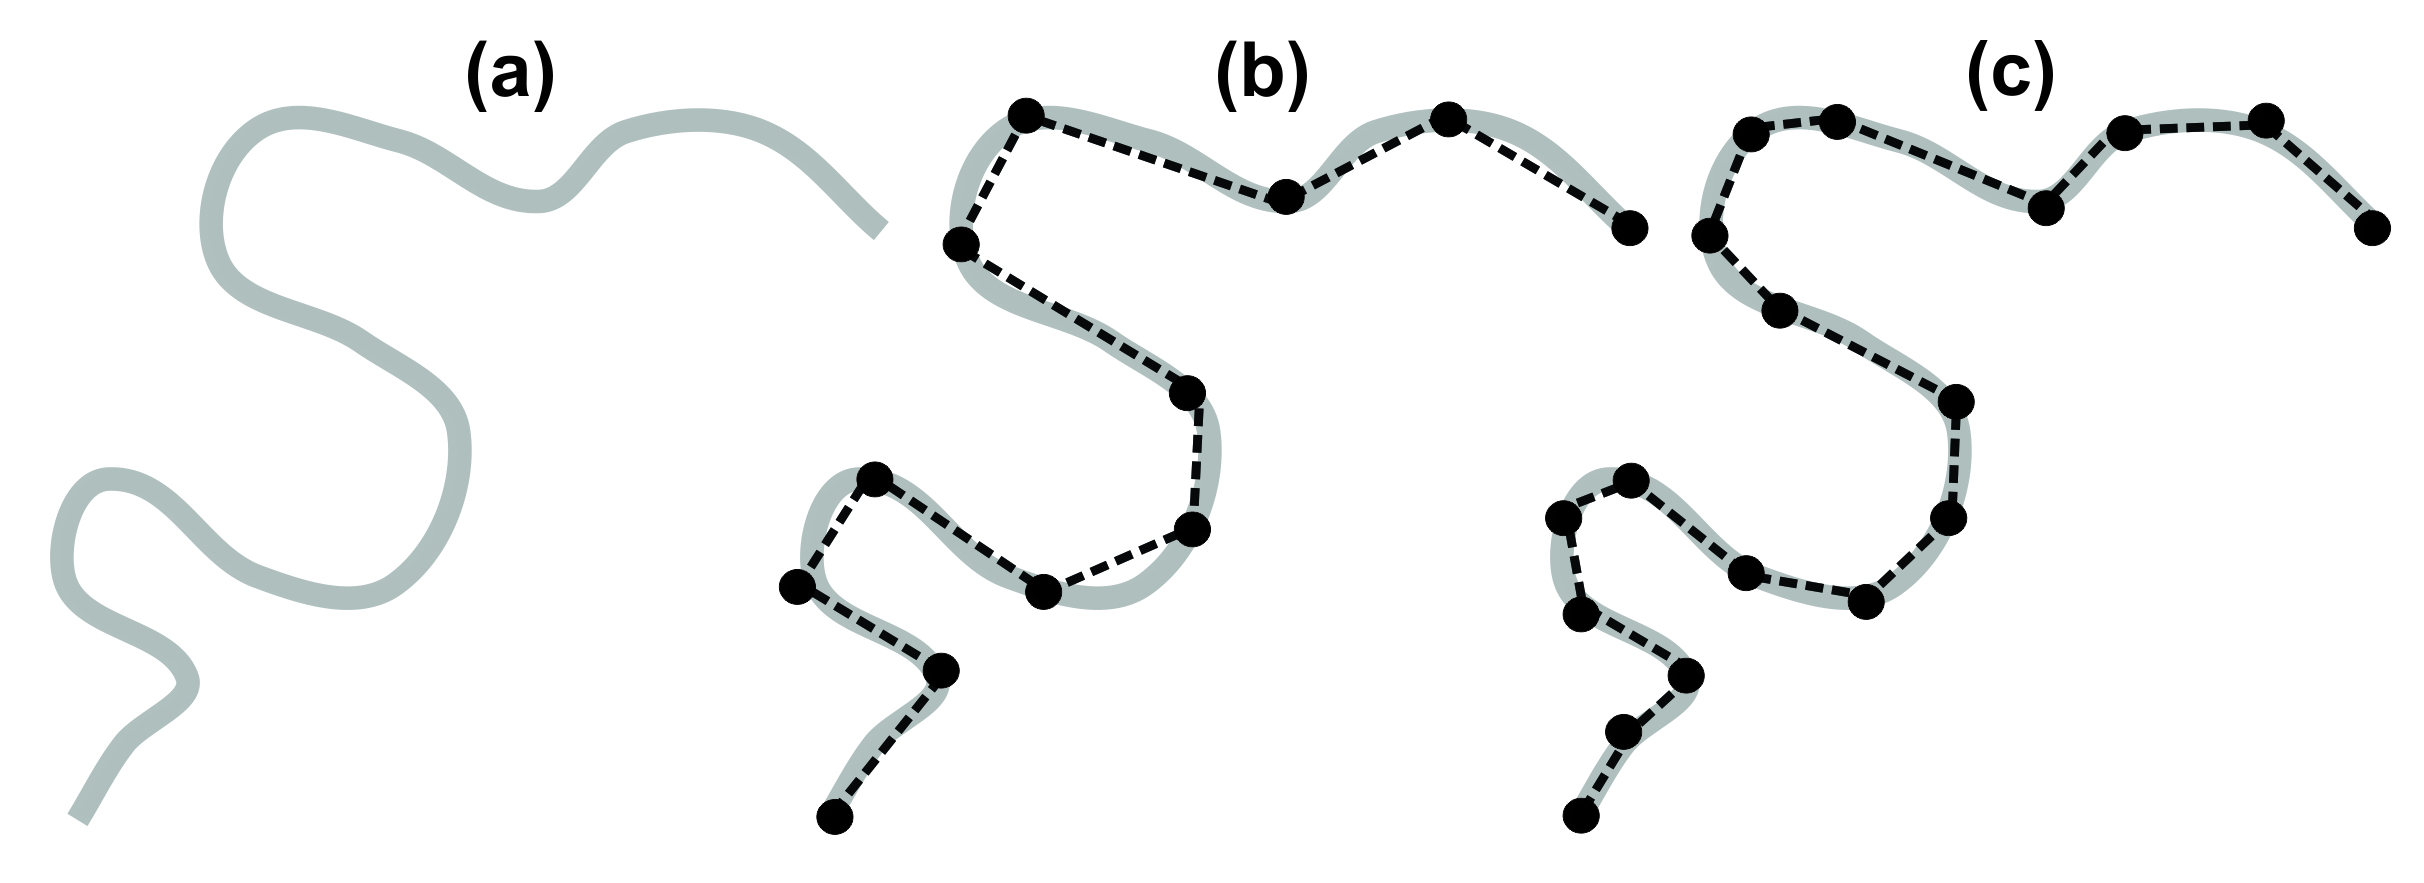
Measuring distances along curvilinear features such as roads and rivers is more complicated. It is possible to use a ruler and then treat the curved lines (Figure 3.6a) as a series of straight segments (Figure 3.6b). Although this method will tend to underestimate the distance, it will certainly give a rough estimate that’s usable. Accuracy can be improved by using shorter straight segments (Figure 3.6c), but this comes at a cost of extra time and effort required.

For instructions on how to derive distances in Google Earth (Web), refer to the Supporting Material.
Lab Exercises
This lab consists of three exercises in which you will practice
- Deriving geographical coordinates, converting between units and using them to find locations on maps and in Google Earth (Web).
- Working with map scales.
- Calculating distances from maps.
You will need a calculator, plus an internet connection to download a map and access Google Earth (Web). Some of the exercises may be easier if you are able to print Figure 3.1. The exercises should take you 1½ to 2½ hours to complete.
These exercises are for you to practice with and test to see if you are correct in preparation for a short quiz the following week. In order to see if your answer is correct, input your answer into the Lab 3 Practice Quiz on Moodle.
EX1: Geographical Coordinates
- Using only Figure 3.1, address the following questions:
a. Derive the latitude and longitude of the 669-metre summit about a kilometre NW of McKinley Reservoir. Express your final answer to the nearest 10″ (i.e. round off to 00″, 10″, 20″, etc.).
b. What feature is at 49° 55′ 40″ N, 119° 23′ 30″ W?
2. Download the 1:50,000 NTS map sheet 01N10 (St. John’s) 8th edition [PDF]. Use only this map for the following questions:
a. What are the geographic coordinates of the centre of the largest industrial building to the east of Octagon Pond, Paradise (lower left part of map)? Express your final answer to the nearest 10″ (i.e. round of to 00″, 10″, 20″, etc.)
b) What feature is at 47º34’13” N, 52º40’55” W?
EX2: Map Scales
Questions 3 – 6. Address all of the following to get some practice using map scales:
3. On a 1:35,000 map, what does a length of 2.0 cm represent?
4. On a 1:125,000 map, what does a length of 4.5 cm represent?
5. The straight-line distance from point A to Point B is 7 km. What length would this be on a 1:20,000 map?
6. Convert the verbal scale One centimetre equals five kilometres to a ratio scale.
7. Assume that you need to use a part of a standard 1:50,000 NTS map in your next term paper, but you had to shrink the map in order to fit it on the page. On your new map, a 10 kilometer distance is 5.8 cm. Is your map a smaller scale or larger scale than 1:50,000? Explain.
8. Assume that you need to use a part of a standard 1:50,000 NTS map in your next term paper, but you had to shrink the map in order to fit it on the page. On your new map, a 10 kilometer distance is 5.8 cm. Calculate the scale of your map.
EX4: Google Earth
9. Open Google Earth (Web).
a. Use Google Earth (Web) to measure how long is the runway at Kelowna airport (in kilometres)? Round your answer off to the closest tenth of a kilometre (1.5 km). Refer to Google Earth procedures in Supporting Material.
10. Open Google Earth (Web) and name the feature that is present at 43° 38′ 33″ N, 79° 23′ 13″ W.
11. You are exploring BC’s beautiful landscapes and are wondering if this is a safe place for the tent. Your GPS indicates that you are here: 54.1895° N, 131.6471° W.
a. Type these coordinates into Google Earth. Would someone want to camp here?
Supporting Material
Instructions for Using and Accessing Maps
Contents
How to Derive Geographical Coordinates from a 1:50,000 NTS Map
How to Measure Distance in Google Earth (Web)
How to Download NTS Topographic Maps
How to Derive Geographical Coordinates From a 1:50,000 NTS Map
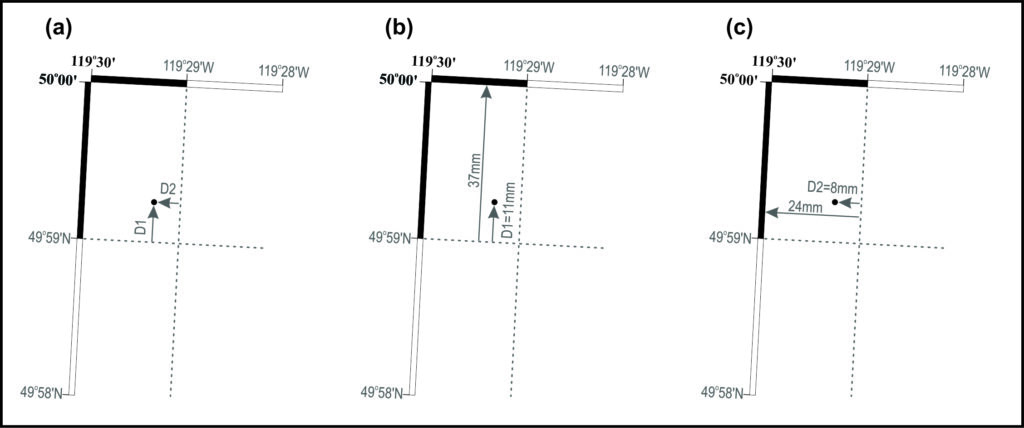
First, take another look at Figure 3.1. We are going to get the coordinates of Wilson Landing. Wilson Landing is located in the top-left of the map. A schematic of the location of Wilson Landing is shown on Figure 3.8.

Step 1: Find the approximate location. Using Figure 3.8a, we can estimate the latitude and longitude: the locations is slightly north of 49° 59′ N and slightly west of 119° 29′ W. Estimating by eye, the arrows indicate that we will add about one-quarter to one-third of one minute of arc to this estimate. To get an answer better than a simple by-eye estimate, we will make measurements on the map. Note that the grey arrows depicting measurements are parallel to the map’s neatlines and not the blue grid squares.
Step 2: Derive latitude (Figure 3.8b). We are looking to derive the proportion of one minute of arc that is between the 49° 59′ N parallel and Wilson Landing: distance D1. On the original map used in here, the proportion is 11mm:37mm. Therefore, distance D1 must be 11/37th of one minute of arc:
![]()
.
Step 3: Derive longitude (Figure 3.8c). We are looking to derive the proportion of one minute of arc that is between the 119° 29′ N meridian and Wilson Landing: distance D2. On the original map used in here, the proportion is 8mm:24mm. So, distance D2 is 8/24th of one minute of arc
![]()
Step 4: Compile. The geographical coordinates of Wilson Landing are 49° 59′ 18″ N, 119° 29′ 20″ W.
Back to Supporting Material contents
How to Measure Distance in Google Earth (Web)
To derive a straight-line distance: The bottom icon on the left-hand menu is a ruler. Click this. Mouse-click once to start a line, then double-click at a second point to end the line. Change the units using the dropdown menu adjacent to the distance in the box that pops up in the top right of the screen.
To derive a curved-line distance: The bottom icon on the left-hand menu is a ruler. Click this. Mouse-click once to start a line, single-click at a point to put your second point, single-click at a point to put your third point, and so-on. Double-click at your final point to end the line.
Back to Supporting Material contents
How to Download NTS Topographic Maps
Option 1: If you don’t know the map sheet’s number: access the Geogratis Topographic Information website and select the Geospatial Product Index – HTML. You can then zoom in or out of the map and the map codes will appear. For example, zoom in on Vancouver: you will first see 92 appear, then a grid with letter codes, and then number-letter-number codes which are the 1:50,000 map IDs; downtown Vancouver is map sheet 92G06. You may get access to the maps directly from here, but if not, record the map sheet number and go to Option 2.
Option 2: If you know the map sheet’s number: access Geogratis’s ftp site for 1:50,000 map sheets. You will find *.tif and *.pdf files available; these are scanned versions of the original NTS map sheets.
Back to Supporting Material contents
Media Attributions
- SMOG
- Fig 14.8 finding-lat-long-v3

